Explore your functional microbiome data interactively!

We are always on the lookout for new ways to help our users get more out of their data. With hundreds of users having run over 4000 Functional Analyses on their samples, we wanted to provide a better way of comparing those results at the project and cohort level. To kick that mission off, you can now plot functional data in our Custom Plots tool!
Background
Our users have been leveraging One Codex’s powerful functional analyses to explore microbial metabolic potential for a range of studies, from human and mouse microbiome projects to microbes from more unusual environments like uranium-rich nuclear waste-contaminated soils1. One Codex’s functional analysis job builds on a variety of functional annotation databases to identify not only more microbes than existing tools like the HUMAnN32 database (Fig. 1), but also more genes, providing you with more information about what microbes might be doing in your samples.
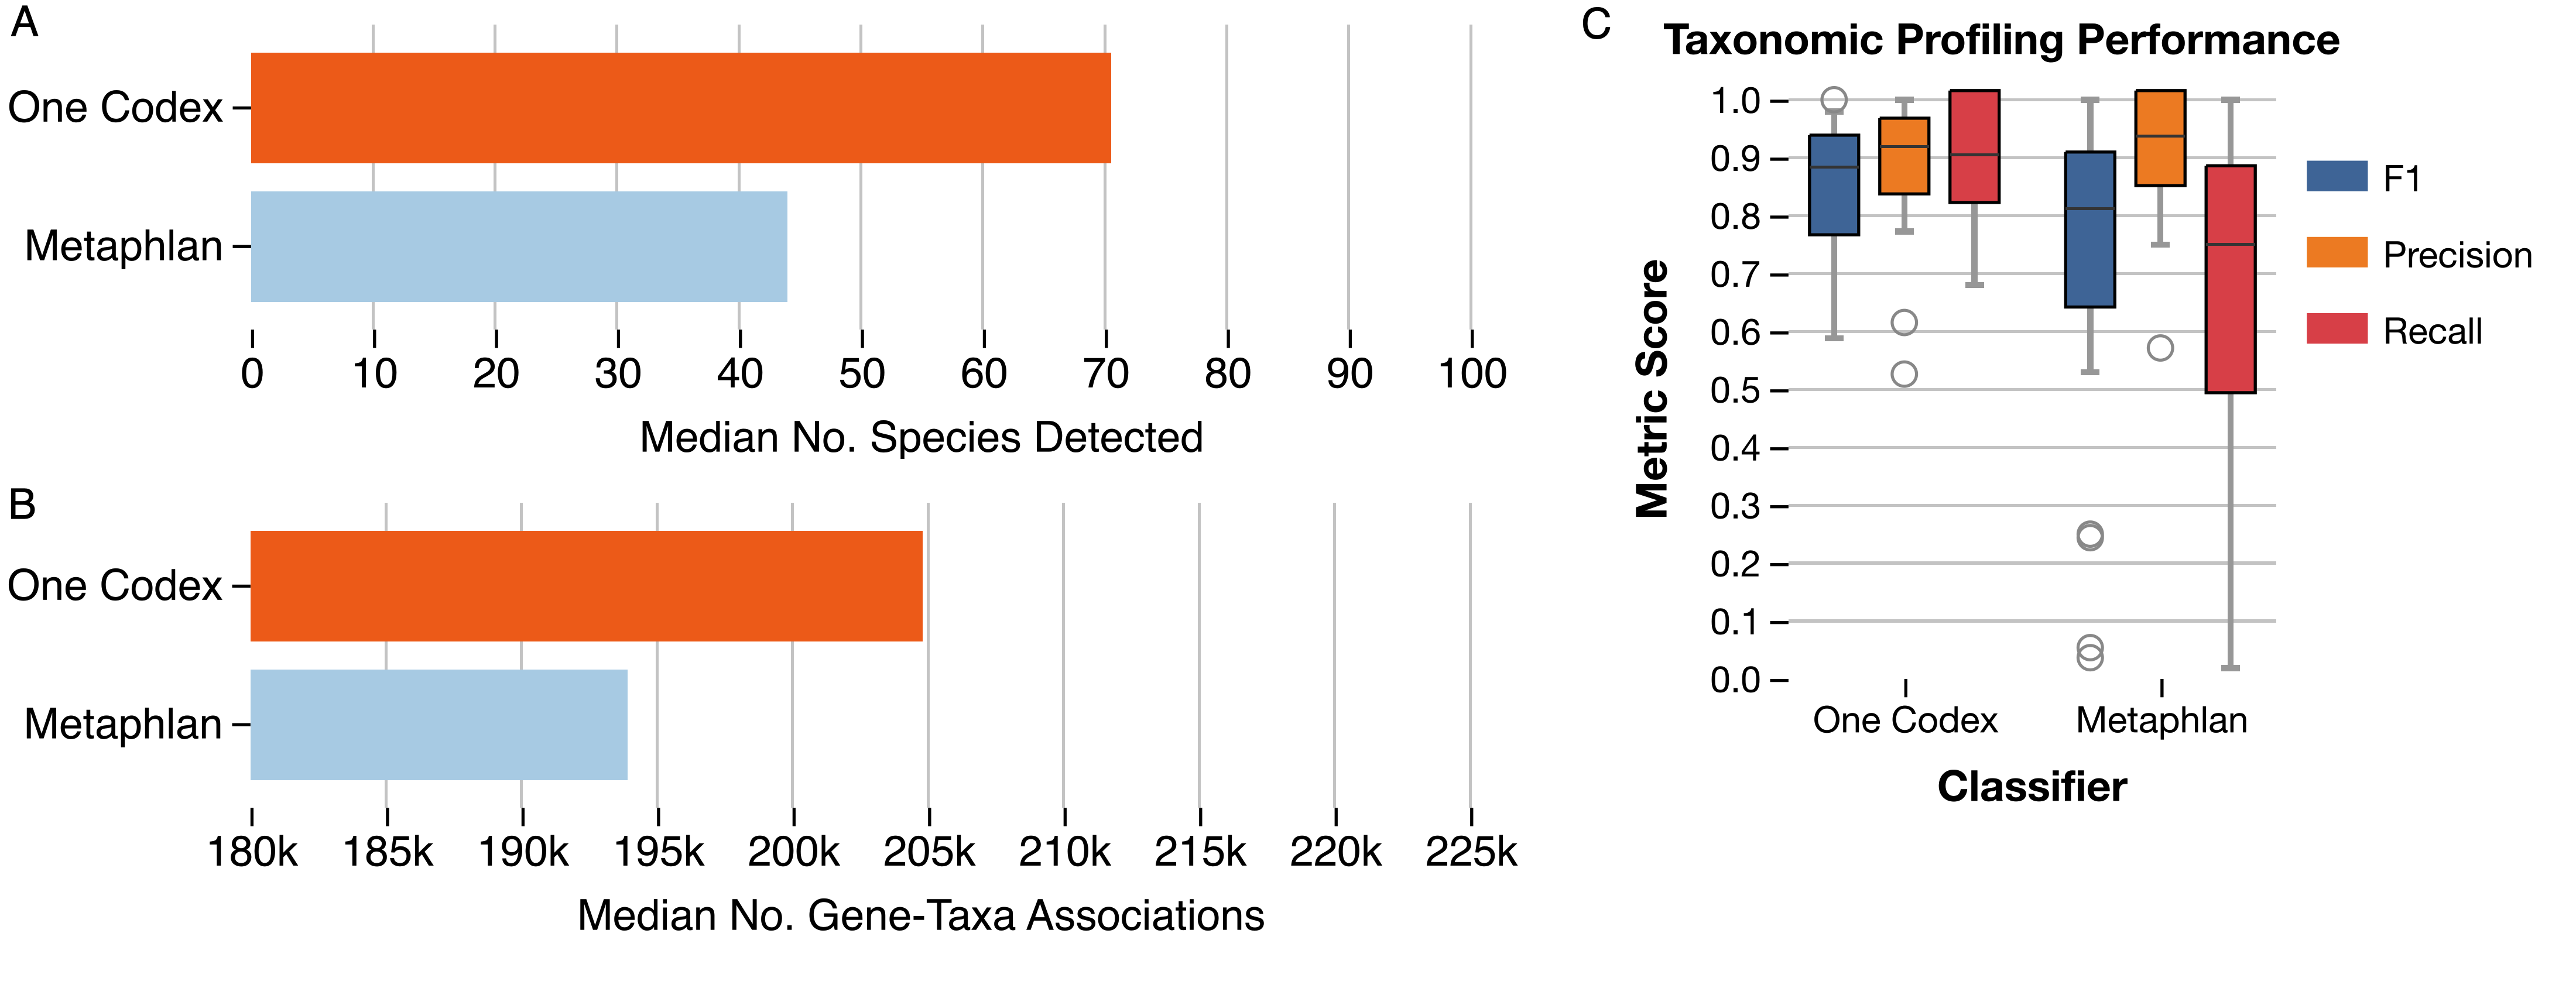
Figure 1: (A) Median number of species and (B) gene-taxa associations identified using the functional analysis pipeline and One Codex database, compared with the functional analysis and MetaPhlAn database. Data for this analysis was pulled from a subset of the Integrative Human Microbiome Project4. Profiling performance was assessed using mock community samples from McIntyre et al5. (C) F1, Precision and Recall of taxonomic profiling when classifying using One Codex compared with MetaPhlAn, demonstrating similar a false positive rate despite significant more taxa detected.
Custom Plots are an easy and convenient way to get a comprehensive overview of the microbial classifications of a group of samples. Our users generate thousands of taxonomic bar charts, alpha diversity plots, PCA/PCoA plots, and beta-diversity heatmaps every month, incorporating all sorts of metadata to group, facet, label and filter their plots and generate great new insights. Now, you can plot functional data to get that same in-depth analysis across batches of functional analyses!
Visualizing functional data is not without its challenges, due to the particularly high-dimensional nature of these data. Not only are there hundreds of thousands of gene families potentially identified for each sample, but these are annotated with a selection of different terms, such as GO terms, KO, EggNOG, PFAM, and EC numbers, each faceted into taxonomic classifications. In Custom Plots, you can choose to generate a functional heatmap using any one of these annotations. As the different functions contribute towards various pathways, we also allow you to plot the top pathways in your samples. As with our other Custom Plots, you can utilize your metadata to facet, label, filter and sort your samples.
Applying One Codex Functional Analysis to Real Data
To show the new tool in action, we’ve imported data from the Sequence Read Archive (SRA) using our SRA import feature from a study exploring the gut microbiome of patients with colorectal adenomas3. In this publication, Feng et al performed whole metagenome shotgun sequencing on fecal samples from advanced adenoma patients, carcinoma patients, and healthy controls. They discovered differences in community profiles between the three groups, with carcinoma patients having a higher number of observed genera than either the advanced adenoma or control groups. Using a random subset of samples from their dataset, we reproduced this finding within Custom Plots (Fig 2). In addition to this, we observed some potential trends in species abundances (Fig. 3), with possible increases in Faecalibacterium prausnitzii and decreases in certain Ruminococcaceae and Ruthenibacterium lactatiformans in carcinoma samples, and to a lesser degree advanced adenoma samples, compared to controls within our subset of samples. We also observed species-level Bray-Curtis dissimilarity differences between the three groups by PCoA plot (Fig. 4), with advanced adenoma samples clustering more to the left of PC1 compared to control samples (right of PC1), further supporting their claim that there were overall microbiome shifts in the advanced adenoma and carcinoma patients compared to controls.
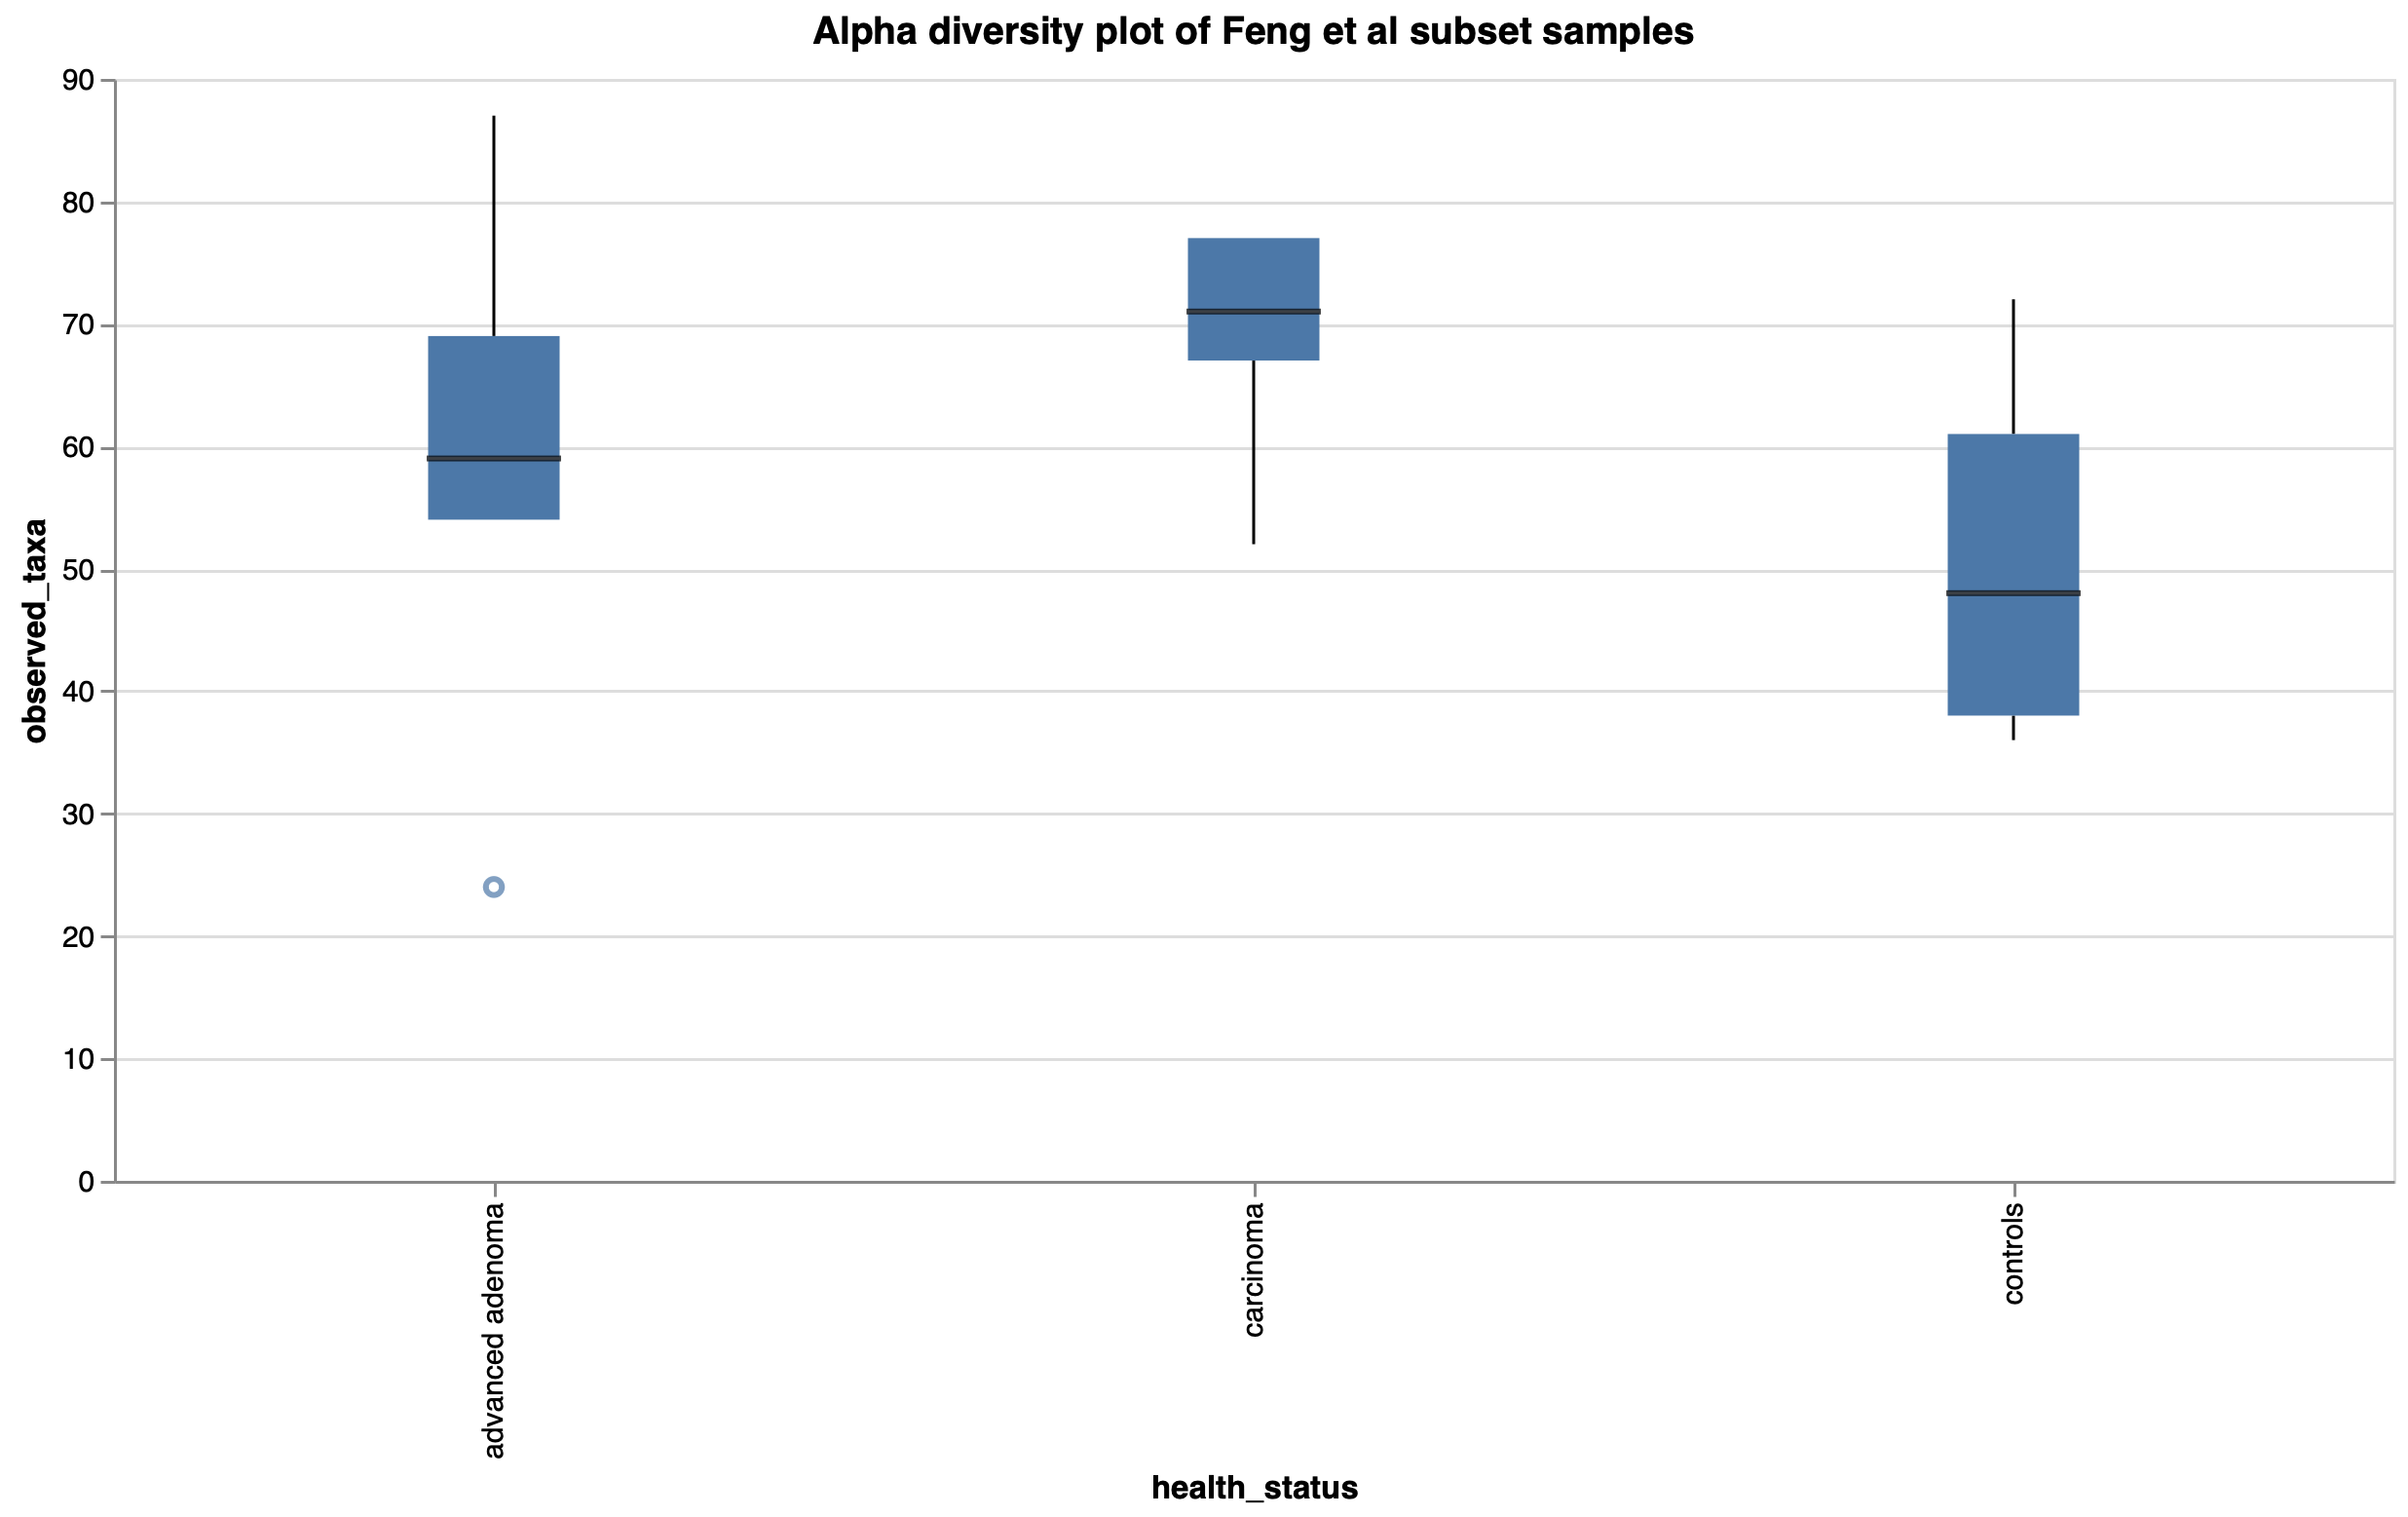
Figure 2: Observed taxa (genera) boxplot by health status in a subset of Feng et al samples.
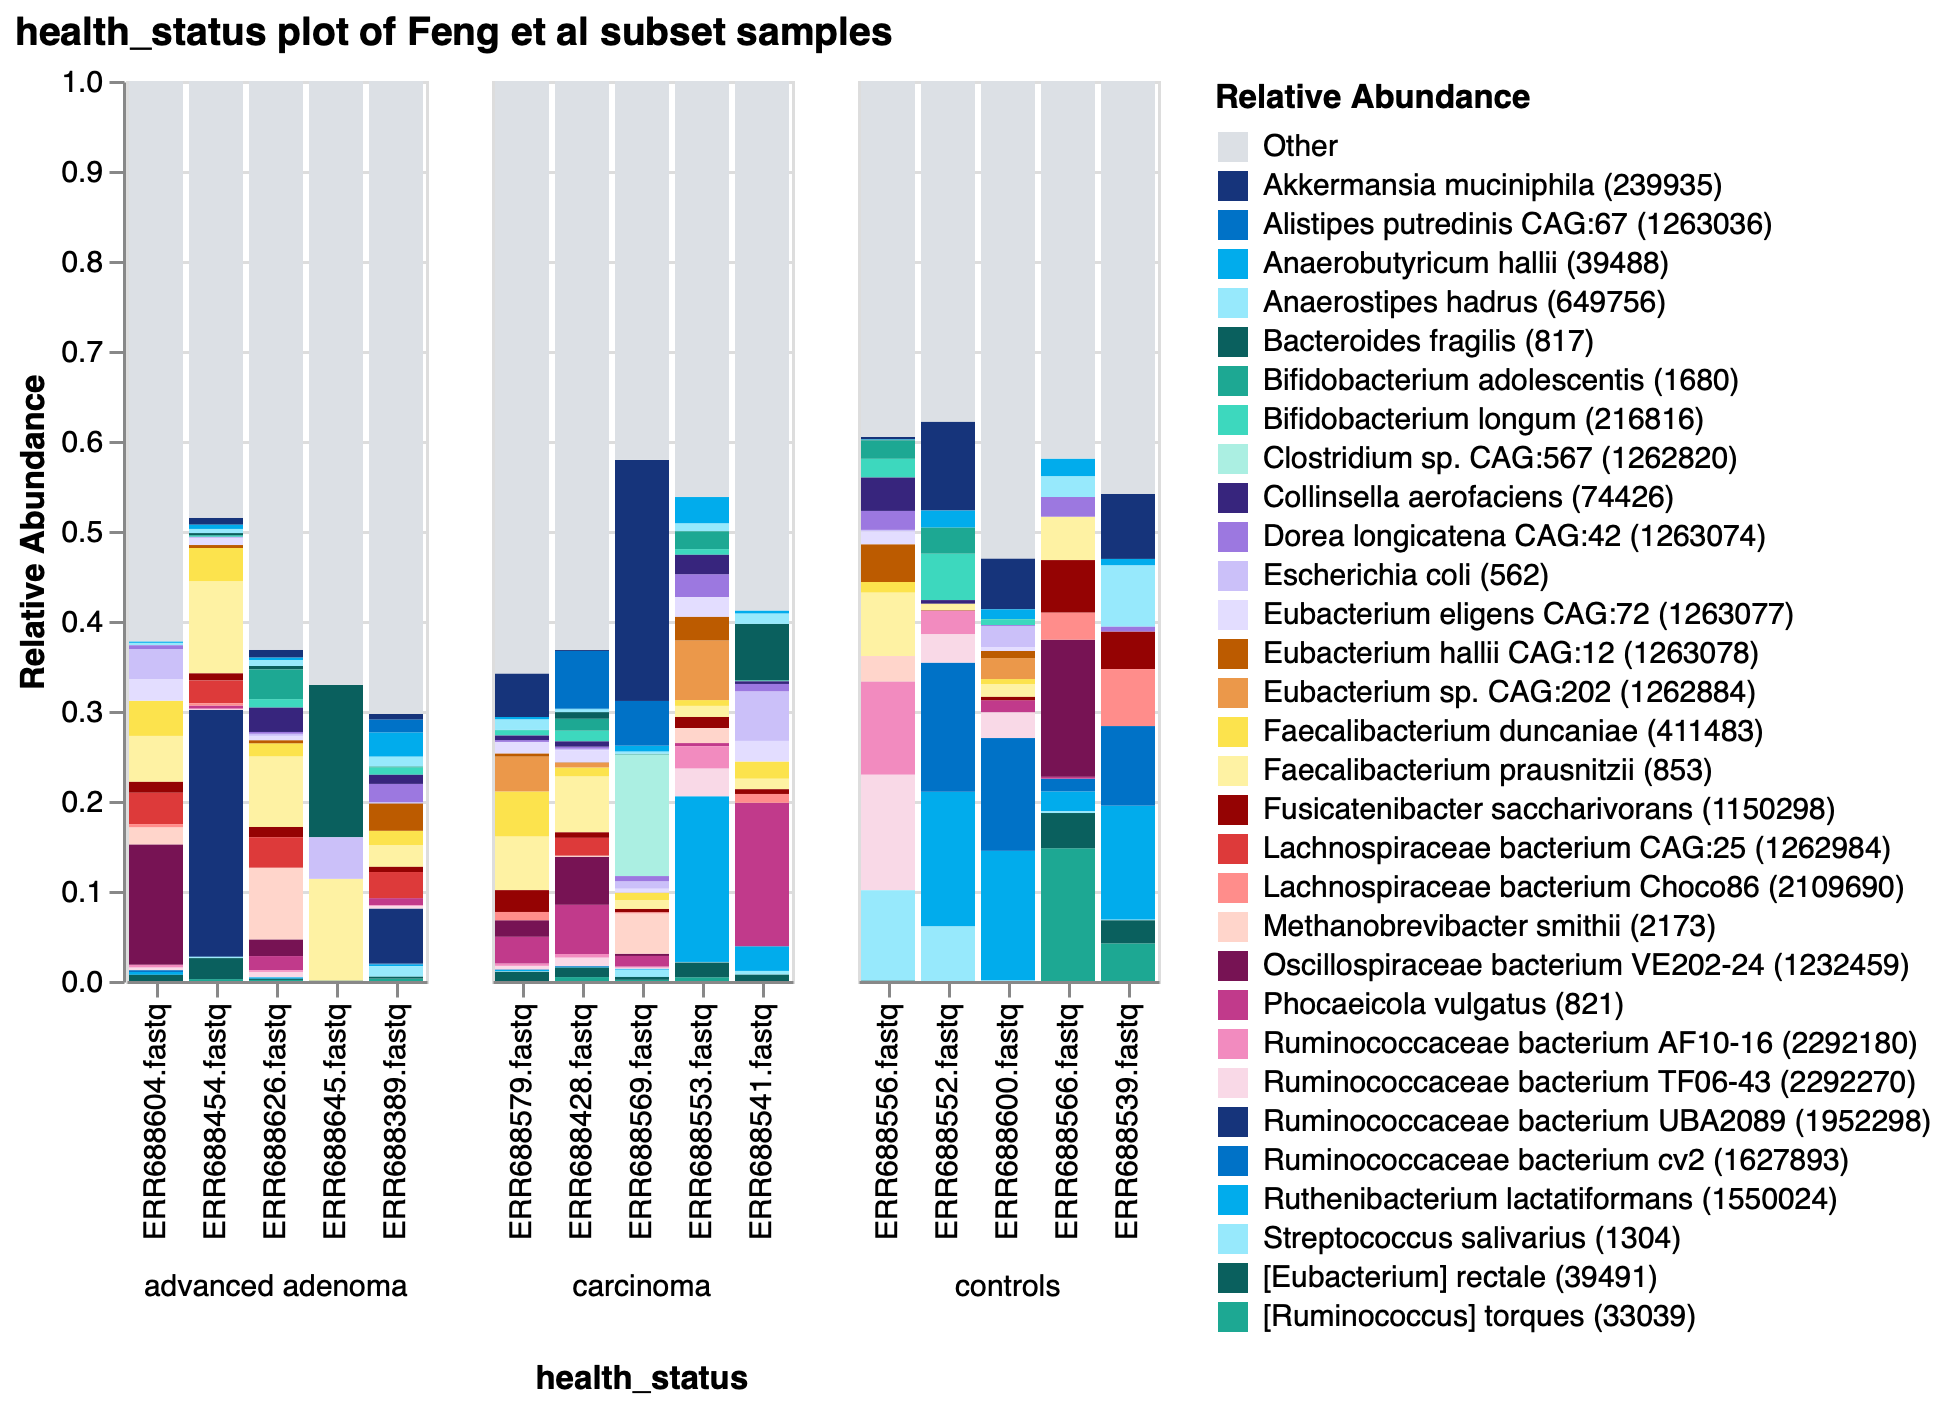
Figure 3: Taxonomic barplot of 30 most abundant species in a subset of Feng et al samples.
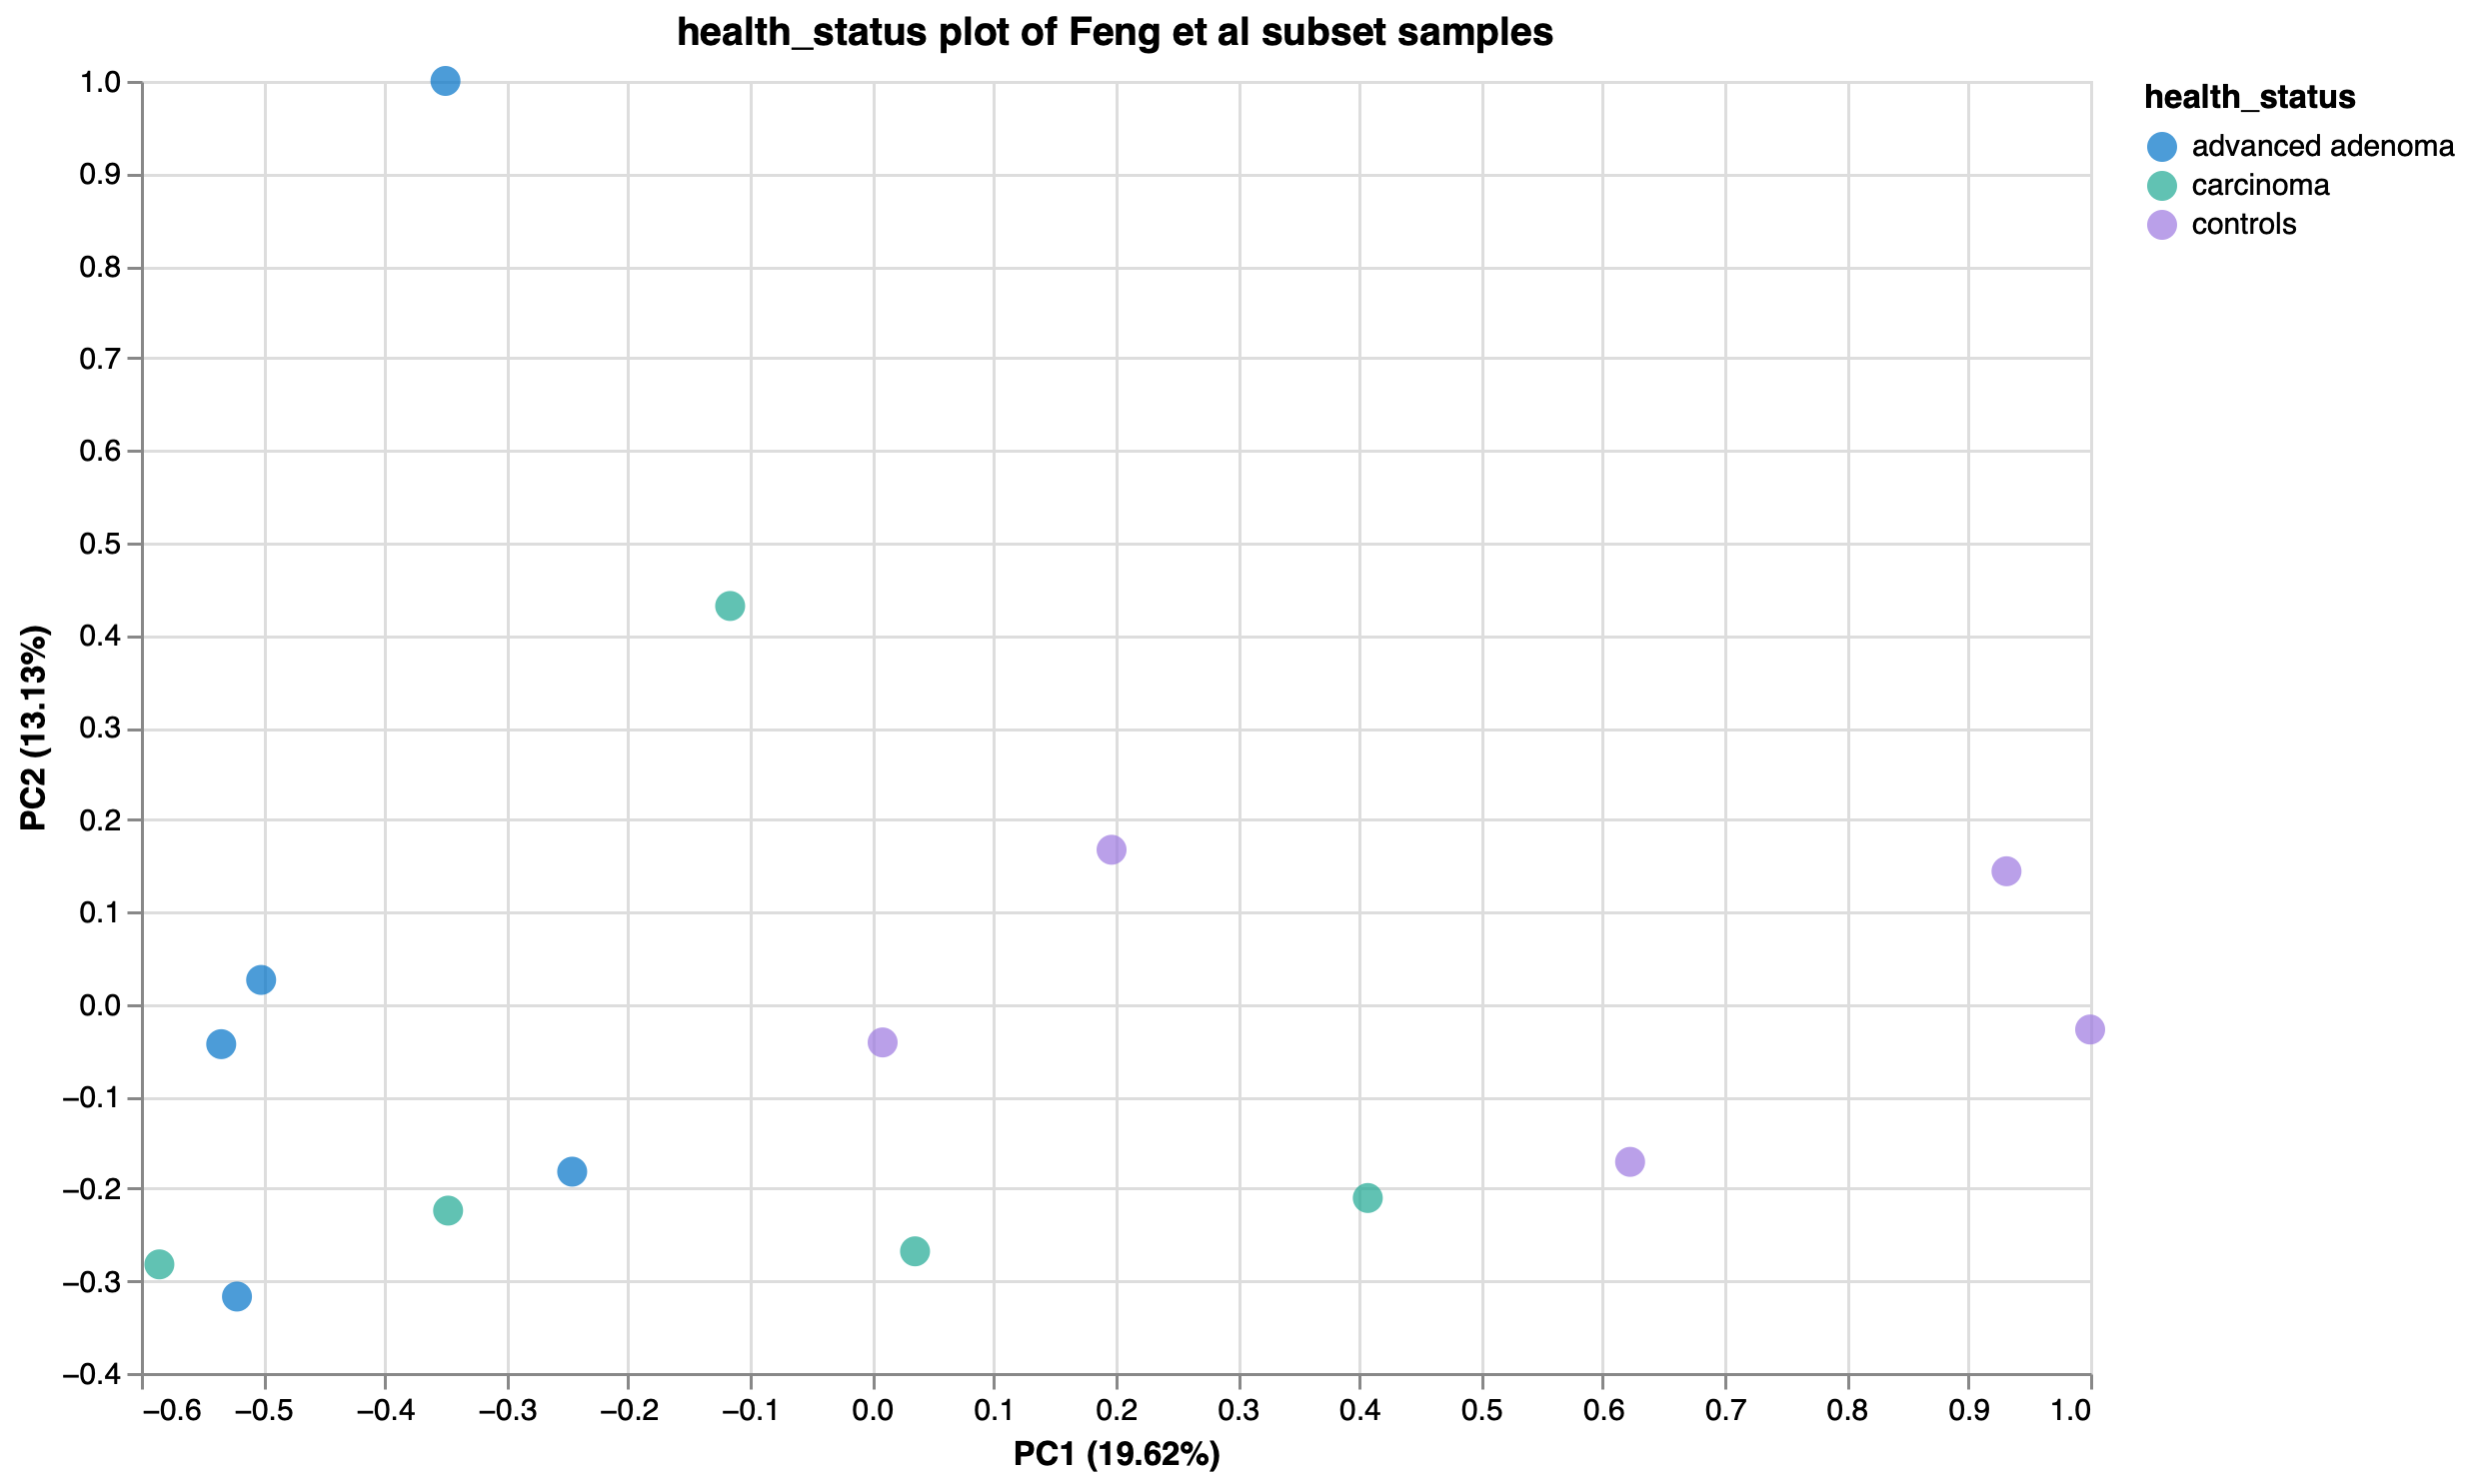
Figure 4: PCoA plot of Bray-Curtis dissimilarity, coloured by health status.
Feng et al reported higher diversity of genes in advanced adenoma and carcinoma samples compared to controls, and identified genes enriched in controls which more often mapped to Kyoto Encyclopedia of Genes and Genomes (KEGG) pathways. Using KEGG Orthology (KO) annotations of the subset of samples, we corroborated this observation, as the top 30 KO functions across the subset of samples were more abundant in the controls than either the advanced adenoma or carcinoma groups (Fig. 5).
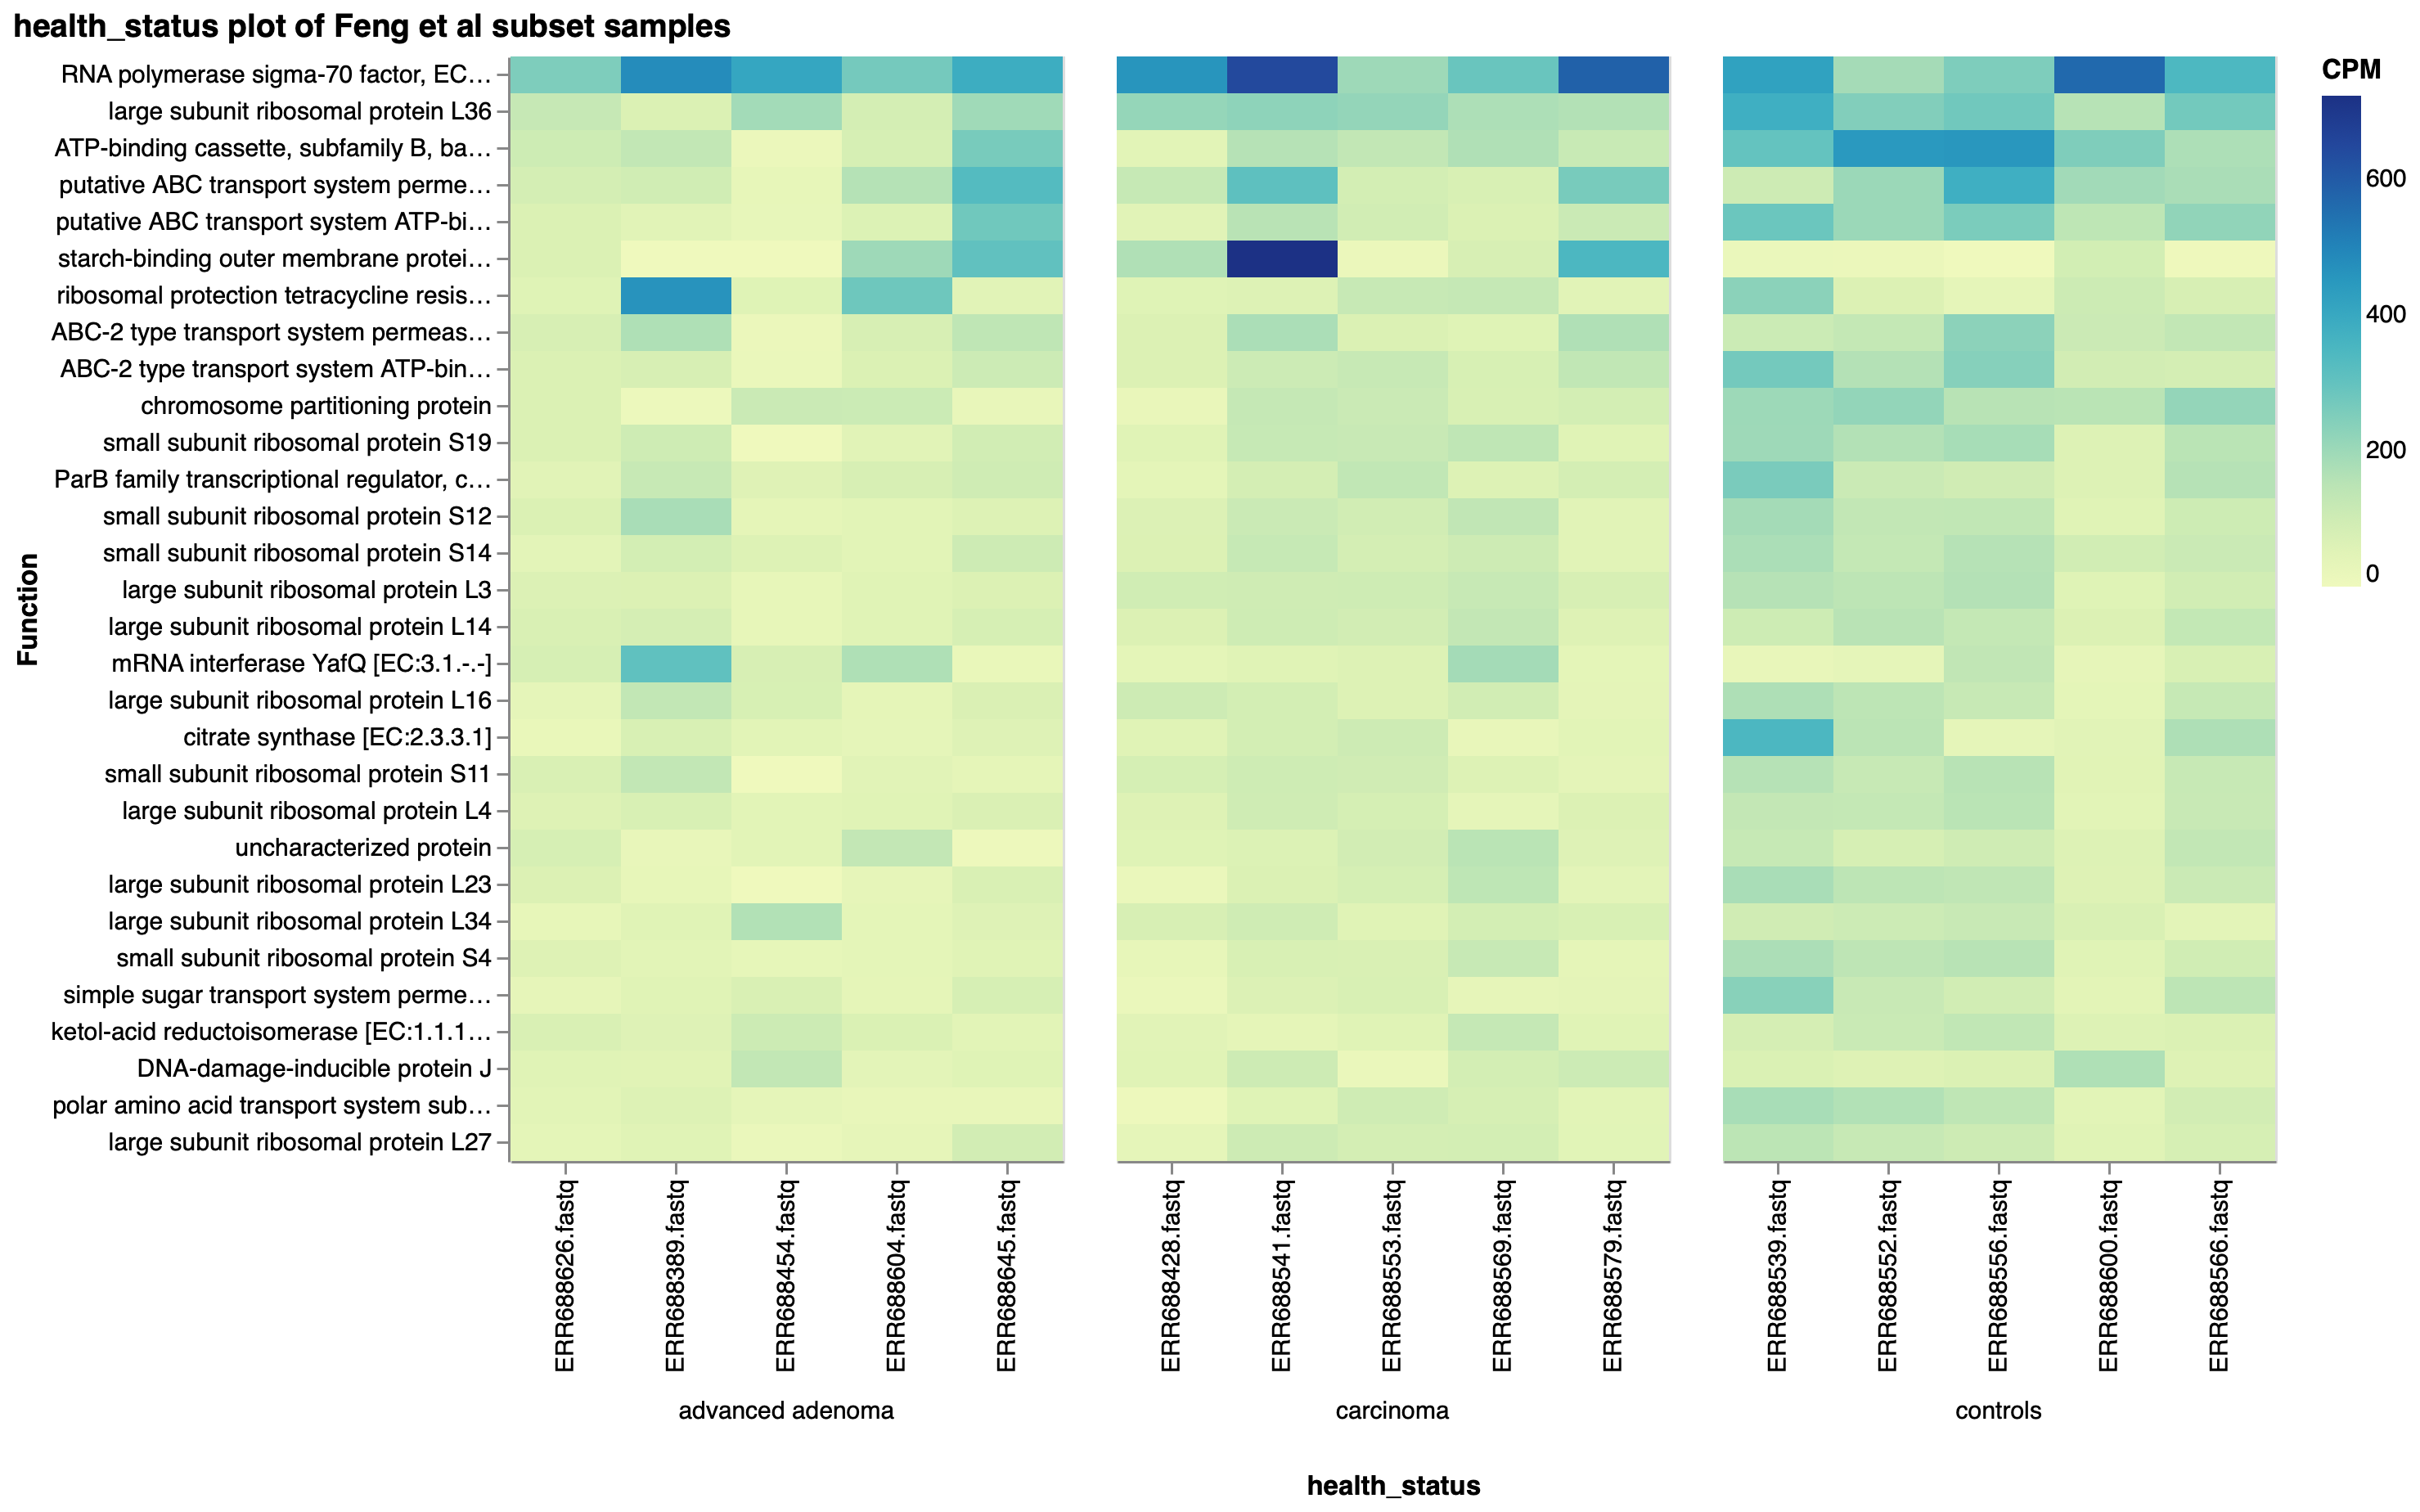
Figure 5: Top 30 KO functions by copies per million (CPM), faceted by health status, in a subset of Feng et al samples.
Similar plots using other functional ontologies, such as EC numbers (Fig. 6a), EggNOG terms (Fig. 6b), or PFAM annotations (Fig. 6c), show similar trends of the top functions averaged across all of the subset samples being higher in the controls. With these top functions accounting for a higher proportion of the functional annotations within the control samples, it stands to reason that there may be fewer functions identified in total in the control samples, which would support Feng et al’s observation of a higher diversity of genes in the carcinoma and advanced adenoma samples.
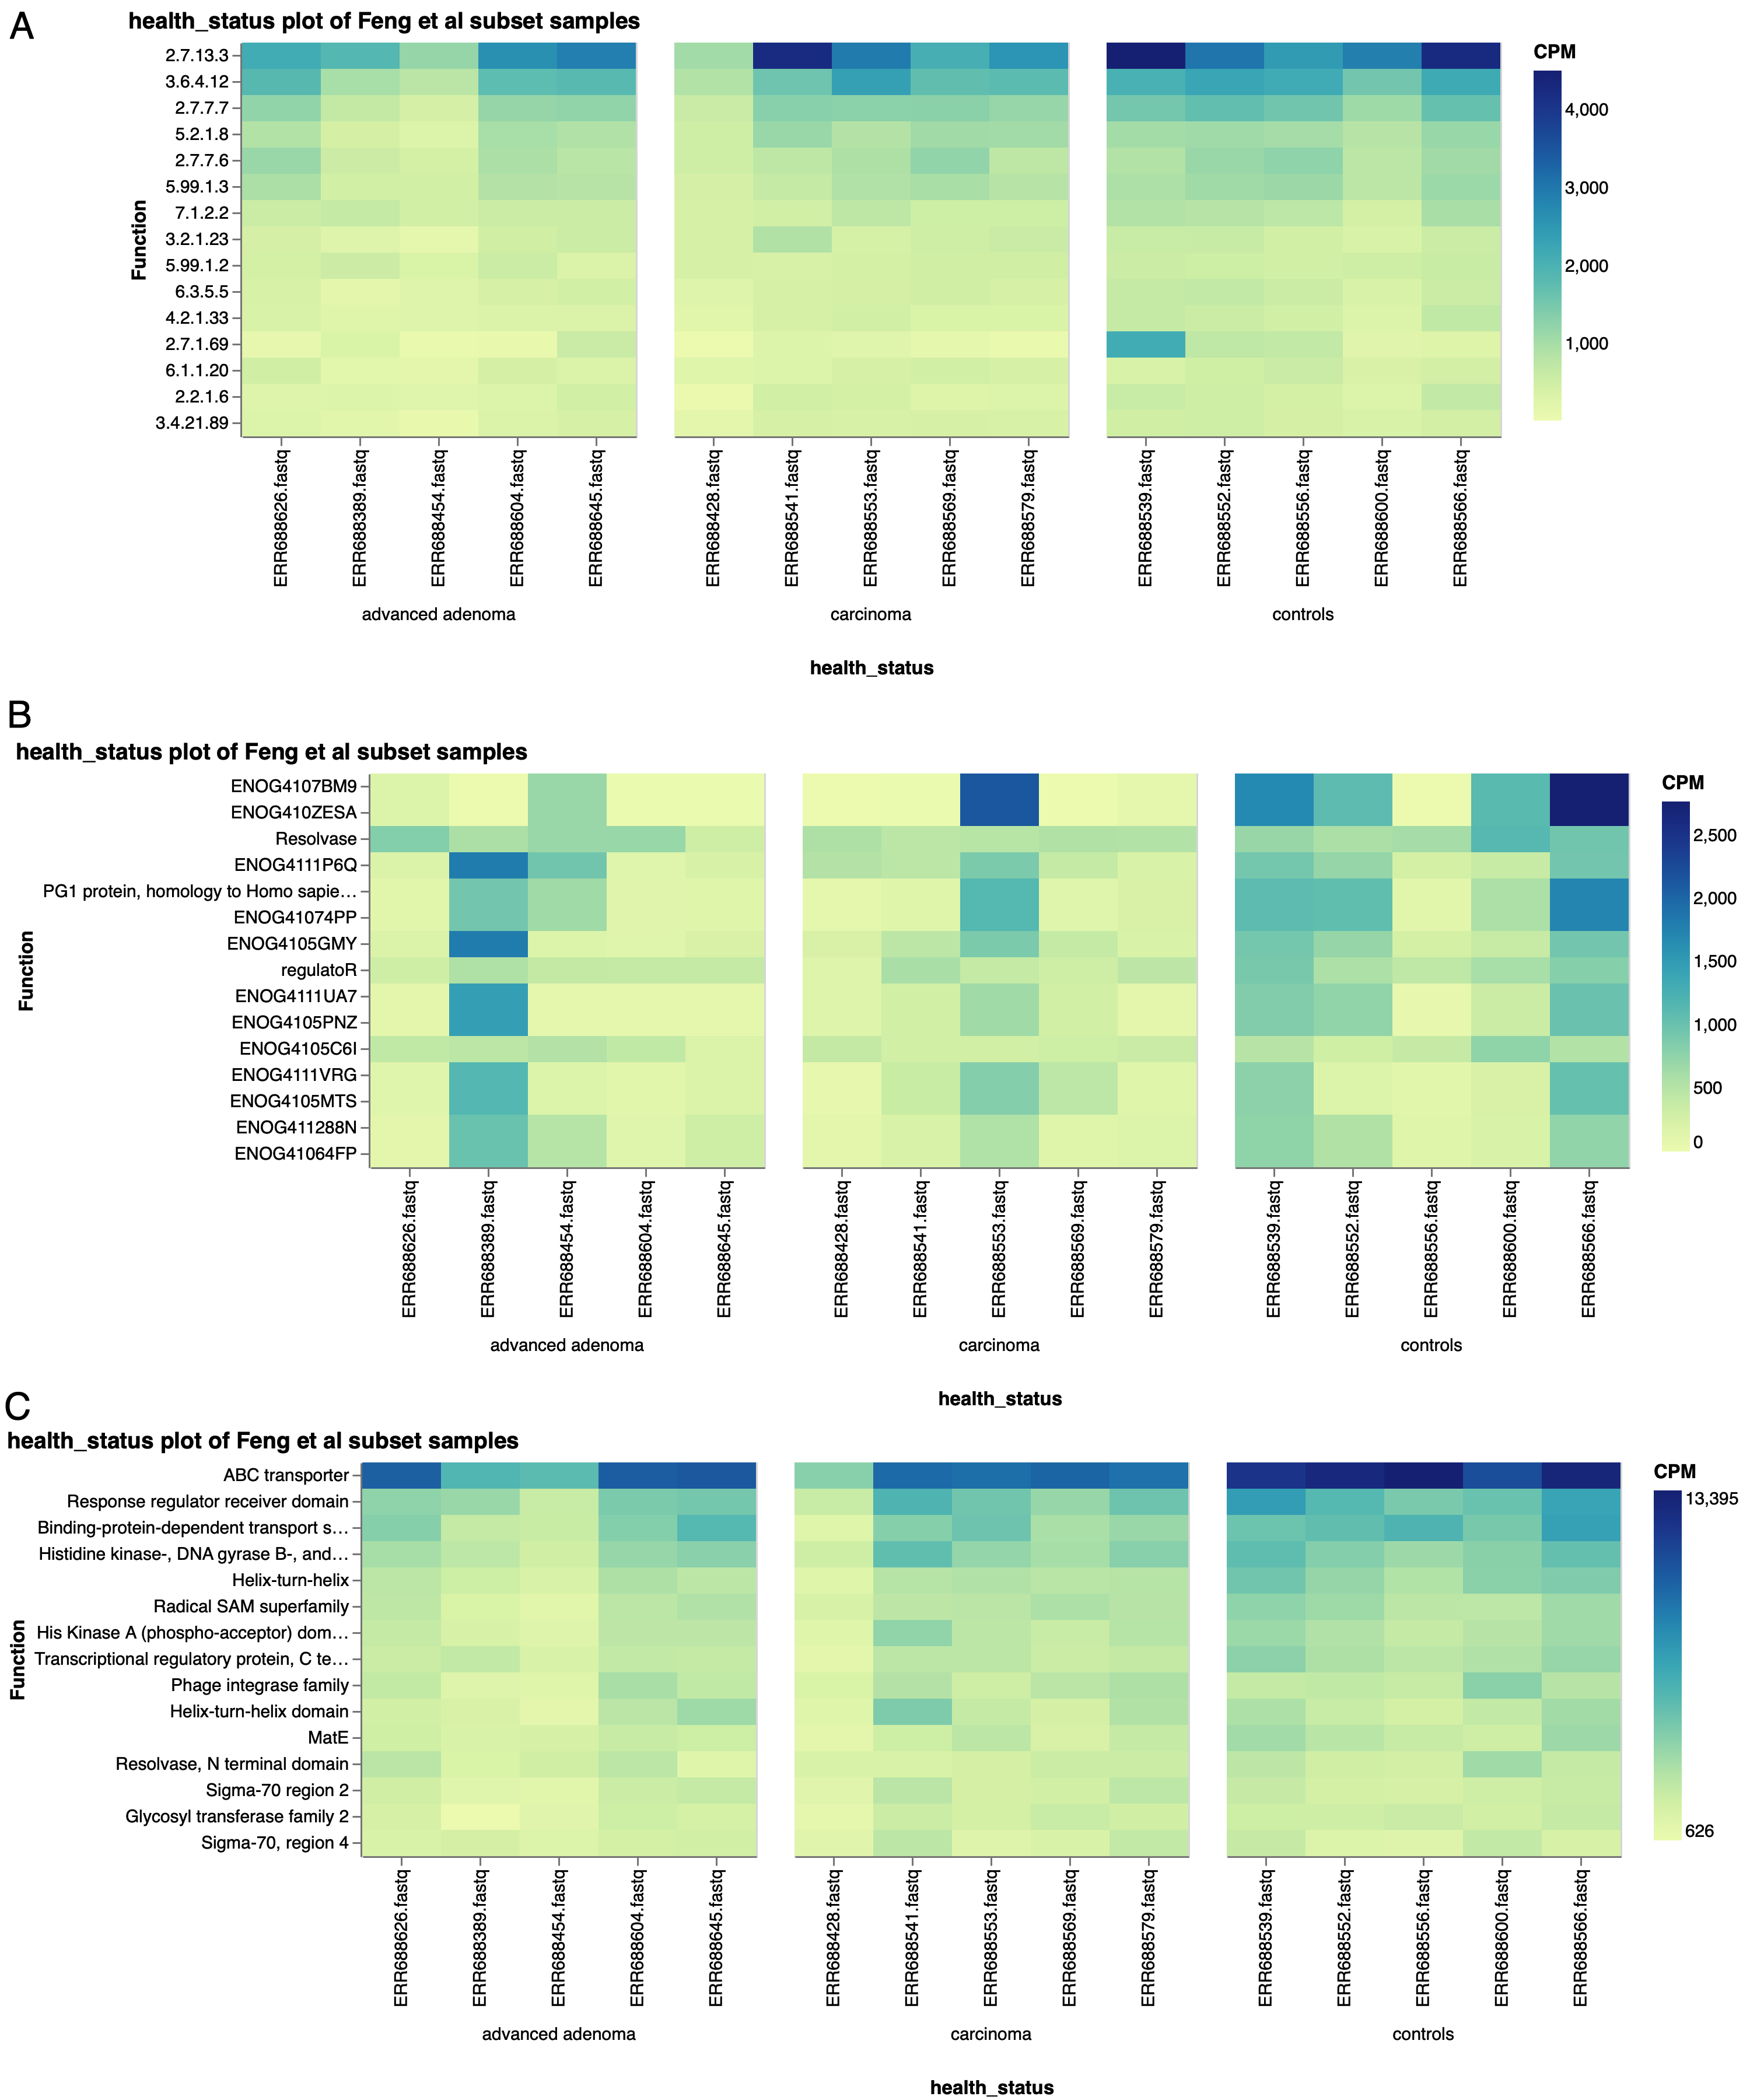
Figure 6: Top 15 functions by a) EC number, b) EggNOG terms, and c) PFAM terms, in a subset of Feng et al samples, separated by health status.
Future Directions
We are excited to continue to add to and expand on the tools on the One Codex platform! We have plans for further iterations of Custom Plots, as well as other ways to manage your functional results. We welcome and encourage any feedback to make this even easier and more valuable for your research, and we love to hear about the kinds of research these features are used for. Feel free to reach out to our team at hello@onecodex.com at any time!
Learn more about our Custom Plots tool through our documentation, or dive into Custom Plots with your own datasets!
References
- Kommu N, Stothard P, Chukwujindu C, Pathak A, Chauhan A. Metagenome Assembled Genomes (MAG) Facilitate a Better Understanding of Microbially-mediated Heavy Metal Resistance in Soils from a Former Nuclear Materials Production Facility. bioRxiv https://doi.org/10.1101/2023.10.20.563326
- Beghini F et al. Integrating taxonomic, functional, and strain-level profiling of diverse microbial communities with bioBakery 3. eLife 2021; 10:e65088; https://doi.org/10.7554/eLife.65088
- Feng Q et al. Gut microbiome development along the colorectal adenoma–carcinoma sequence. Nat Commun. 2015 Mar; 6, 6528; https://doi.org/10.1038/ncomms7528
- Lloyd-Price, J. et al. Multi-omics of the gut microbial ecosystem in inflammatory bowel diseases. Nature 569, 655–662 (2019); https://doi.org/10.1038/s41586-019-1237-9
- McIntyre, A. B. R. et al. Comprehensive benchmarking and ensemble approaches for metagenomic classifiers. Genome Biology 18, 182 (2017); https://doi.org/10.1186/s13059-017-1299-7